Targets without the noise
The targets view collapses the invocation’s build graph to what matters: which targets built, which failed, and how long each took.
Test inspection
All test targets with status and duration, filterable and sortable, with per-test logs one click away.
Every build, captured in full
Every invocation is captured in full: build logs with full-text search, per-test logs, target outcomes with timings, and the cache hit counts that explain why a build was fast or slow. View logs in place, raw, or downloaded, and share a deep link to the exact invocation instead of pasting log fragments into chat.
The Details tab
Every invocation carries a Details tab with the full story of the build:- Build profile: download the full, concurrent timeline of the build, showing the true critical path, idle gaps, and scheduling delays. Open it in Perfetto or
chrome://tracingto see exactly where wall-clock time went. - Target outcomes: tests passed and cached, targets built and skipped, charted at a glance.
- Invocation details: status and exit code, start, end, and elapsed time, Bazel version, command and pattern, workspace, and counts of targets configured, packages loaded, and actions executed.
- Target configuration: identifiers and Make variables for the targets in the invocation.
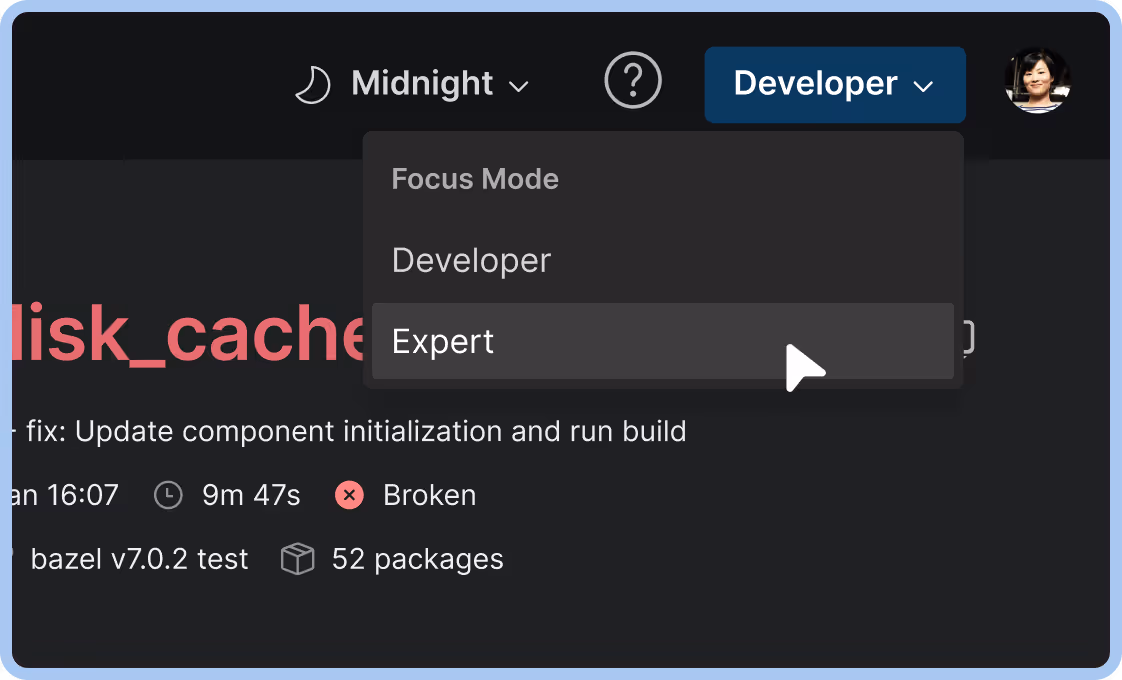
Detail at the level you need
Developer and focus modes adjust how much detail an invocation shows, so a product engineer chasing one red test and a build engineer profiling the whole invocation each see the right view.