> ## Documentation Index
> Fetch the complete documentation index at: https://site.aspect.build/llms.txt
> Use this file to discover all available pages before exploring further.
# Locating and interpreting Bazel timing profiles
> Locate Bazel's automatic timing profile, view it with bazel analyze-profile or Perfetto, and spot critical-path actions and easy performance wins.
Every run of Bazel produces a profile. You don't need to set any flags to have one.
You should configure CI builds to collect the Bazel profile and store the result where possible.
By default the profile of your most recent `bazel` invocation can be found in `$(bazel info output_base)/command.profile.gz`
It can be viewed in a couple ways:
* [`bazel analyze-profile`](https://bazel.build/docs/user-manual#analyze-profile) `[path to profile]` shows the time-per-phase and the Critical Path
* Navigate to [https://ui.perfetto.dev](https://ui.perfetto.dev/) and load the profile using your browser for an interactive session.
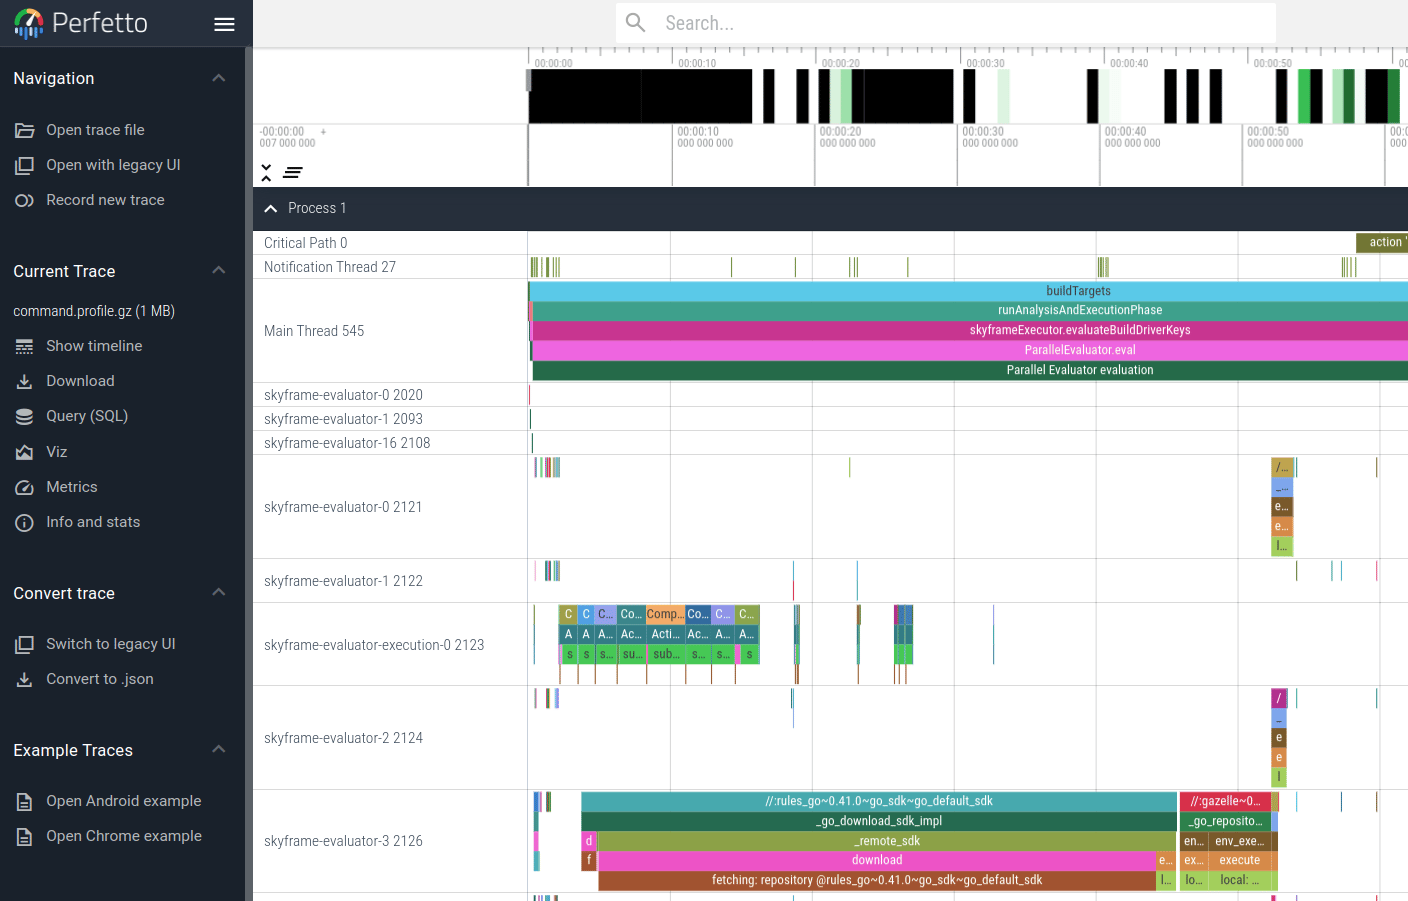 You'll often spot some easy low-hanging fruit in the profile, such as an action taking much longer
than it should, or running when it doesn't need to.
Exercise: let's understand the example build and test timing by profiling it.
1. Run any `bazel` command in the bazel-examples repository, for example, `bazel test //client/...`
2. Open the profile.
3. Look for some things we want to improve. Is there anything in the profile we didn't expect?
You'll often spot some easy low-hanging fruit in the profile, such as an action taking much longer
than it should, or running when it doesn't need to.
Exercise: let's understand the example build and test timing by profiling it.
1. Run any `bazel` command in the bazel-examples repository, for example, `bazel test //client/...`
2. Open the profile.
3. Look for some things we want to improve. Is there anything in the profile we didn't expect?